Pair and Timeframe
NZDUSD – 4H
Analysis Platform
I am using TradingView to do all of my analysis, they really have a great website and by far is the best analysis tool I’ve ever seen. So be sure to check it out, they have a free plan and more advanced plans (multiple charts, extended hours trading, etc).
Method
The burst moves. If you haven’t seen my guide on how to trade with this method, please take a moment to read it here.
Previous Week Analysis
This is my first analysis on this pair, however I’m planning of taking a picture as a summary of what my analysis looked like the previous week to check if we made a profit or a loss.
Next Week Analysis
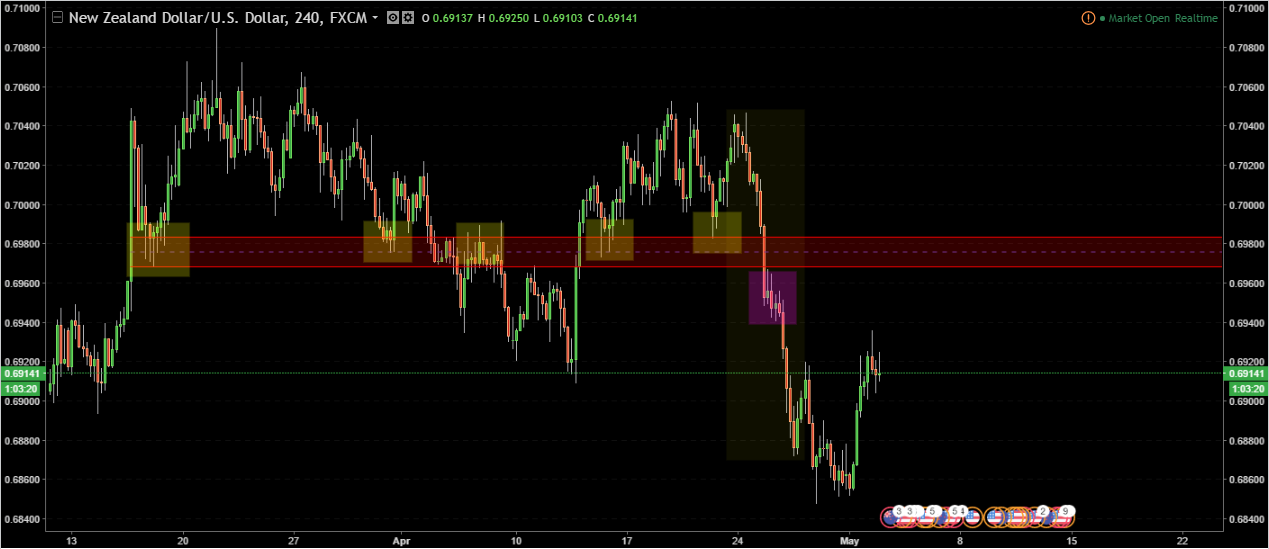
I will keep this really simple and effective, so let’s take a look a the burst moves first:
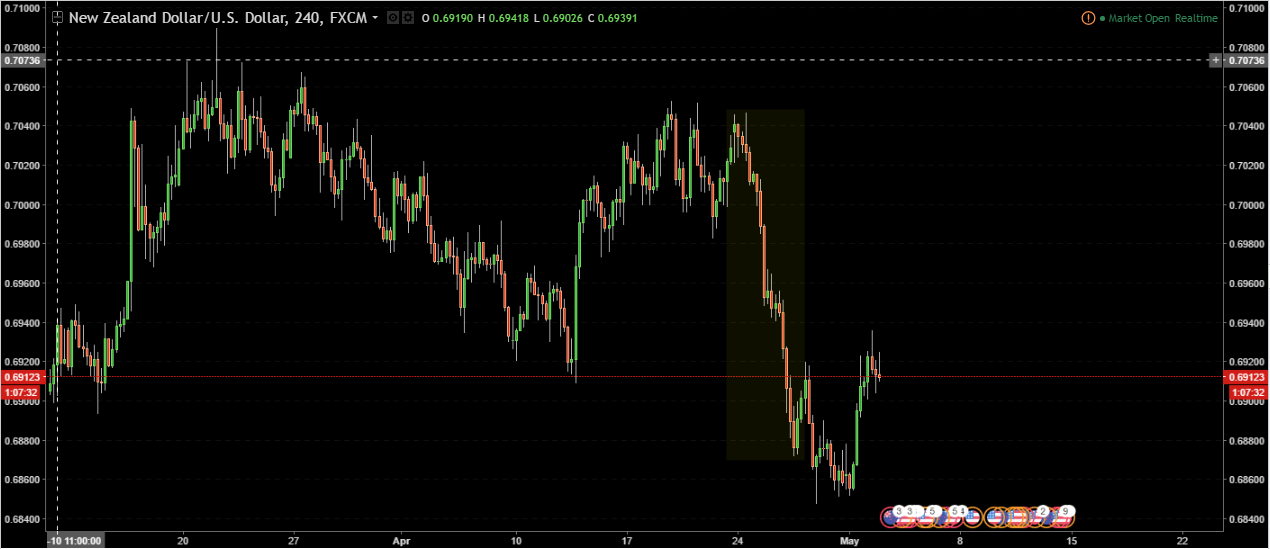
As we can see on the chart, there is only one big burst move, so we will check on the latest support/resistance level that could provide a good opportunity for us this week:

Price is approaching the zone from below. As we can see, the zone we drew is very strong and supported by all the yellow rectangles acting as previous levels of support and resistance.
The purple rectangle is another area of interest. Is very likely that price will bounce on this zone, however, we have to think in advance about our risk to reward analysis and this zone would give us a lower RR potencial, so we’ll leave it for now.
Risk/Reward
This trade has a lot of potencial, this is my estimation of how much RR we can get out of it:
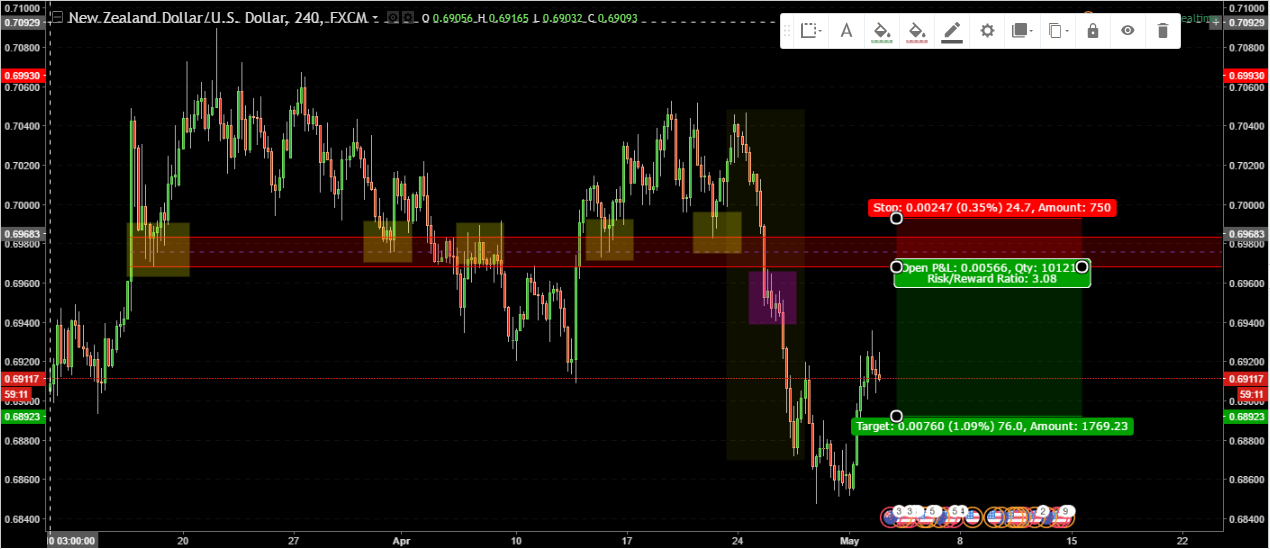
The take profit limit is well below the current entry price at 0.6968. For our stops I would recommend to put it a little bit above the end of our identified zone, giving us a really amazing 3:1 RR!!!
Thank You
Thanks all for reading this and I really hope it’s useful. If you like it, please vote and follow!
Best regards,
@daniel.dalo

Leave a comment